Description
Flaky tests are tests whose outcome changes without altering the test or the code under test. These tests become unreliable, and they have been found to impact test-suite in large industrial projects. As a result, these have become an active area of research. Most of this research focuses on traditional unit tests found in non-interactive, non-UI projects. For this reason, we perform a study on these UI flaky tests to identify their root causes, how they manifest, and how they are fixed.Dataset
Browse by Projects
Raw Data
Tables
Table 2 shows the total number of results returned for each of the keywords used in the crawling procedure for web projects. It also breaks down the results further by showing the results after appling the keyword filtering. From these found projects, we performed manual inspection on the commits to identify those containing real flaky tests.
| UI Topic | Projects | Commits | Flaky Keyword Filtering | UI Keyword Filtering |
|---|---|---|---|---|
| web | 999 | 772901 | 2553 | 210 |
| angular | 998 | 407434 | 222 | 19 |
| vue | 998 | 344526 | 52 | 1 |
| react | 997 | 1110993 | 603 | 30 |
| svg | 995 | 135563 | 24 | 1 |
| bootstrap | 995 | 98264 | 112 | 0 |
| d3 | 980 | 106160 | 82 | 1 |
| emberjs | 629 | 3961 | 1 | 0 |
Table 4 presents the breakdown of root cause categories and their counts to match better with existing work. The high level categories can be further broken down into subcategories. We found that the highest causes of flakiness come from causes under Async Wait.
In this table, the cells marked in yellow have been changed to reflect new category names and counts. The cells in blue are categories that are unique to UI flakiness.
| Root Cause Categories | Root Cause Subcategories | Web | Mobile | total |
|---|---|---|---|---|
| Async Wait | Network Resource Loading | 15 | 4 | 19 |
| Resource Rendering | 47 | 14 | 61 | |
| Animation Timing Issue | 17 | 9 | 26 | |
| Environment | Platform Issue | 16 | 18 | 34 |
| Layout Difference | 9 | 1 | 10 | |
| Test Runner API Issue | DOM Selector Issue | 13 | 3 | 16 |
| Incorrect Test Runner Interaction | 10 | 14 | 24 | |
| Test Script Logic Issue | Unordered Collections | 5 | 0 | 5 |
| Time | 1 | 0 | 1 | |
| Incorrect Resource Load Order | 11 | 11 | 22 | |
| Test Order Dependency | 6 | 6 | 12 | |
| Randomness | 2 | 3 | 5 | |
| Total | 152 | 83 | 235 |
Table 5 shows the breakdown of tests by the manifestation strategy uses when reporting the flaky test.
| Manifestation Category | Web | Mobile | Total |
|---|---|---|---|
| Unspecified | 101 | 40 | 141 |
| Specify Problematic Platform | 21 | 17 | 38 |
| Reorder/Prune Test Suite | 9 | 3 | 12 |
| Reset Configuration Between Tests | 2 | 7 | 9 |
| Provide Code Snippet | 14 | 6 | 20 |
| Force Environment Conditions | 5 | 10 | 15 |
| Totals | 152 | 83 | 235 |
Table 6 shows the breakdown of the fixing strategies used to mitigate the flaky behavior in the tests.
| Categories | Subcategories | Web | Mobile | Total |
|---|---|---|---|---|
| Delay | Add/Increase Delay | 14 | 7 | 21 |
| Fix Await Mechanism | 35 | 8 | 43 | |
| Dependency | Fix API Access | 1 | 12 | 13 |
| Change Library Version | 1 | 6 | 7 | |
| Refactor Test | Refactor Logic Implementation | 49 | 26 | 75 |
| Disable Features | Disable Animations | 1 | 3 | 4 |
| Remove Test | Remove Test | 51 | 22 | 73 |
| Total | 152 | 84 | 236 |
Figures
We also try to map root causes to their manifestation and fixing strategies. Based on our observation, flaky tests under each root cause category are reproduced by multiple manifestation strategies, while different fixing strategies are commonly applied to different root causes. In our dataset, each manifestation strategy is correlated to all root cause categories, so we omit the correlation links in the figure. Figure 1 shows the relationship between root causes and fixing strategies.
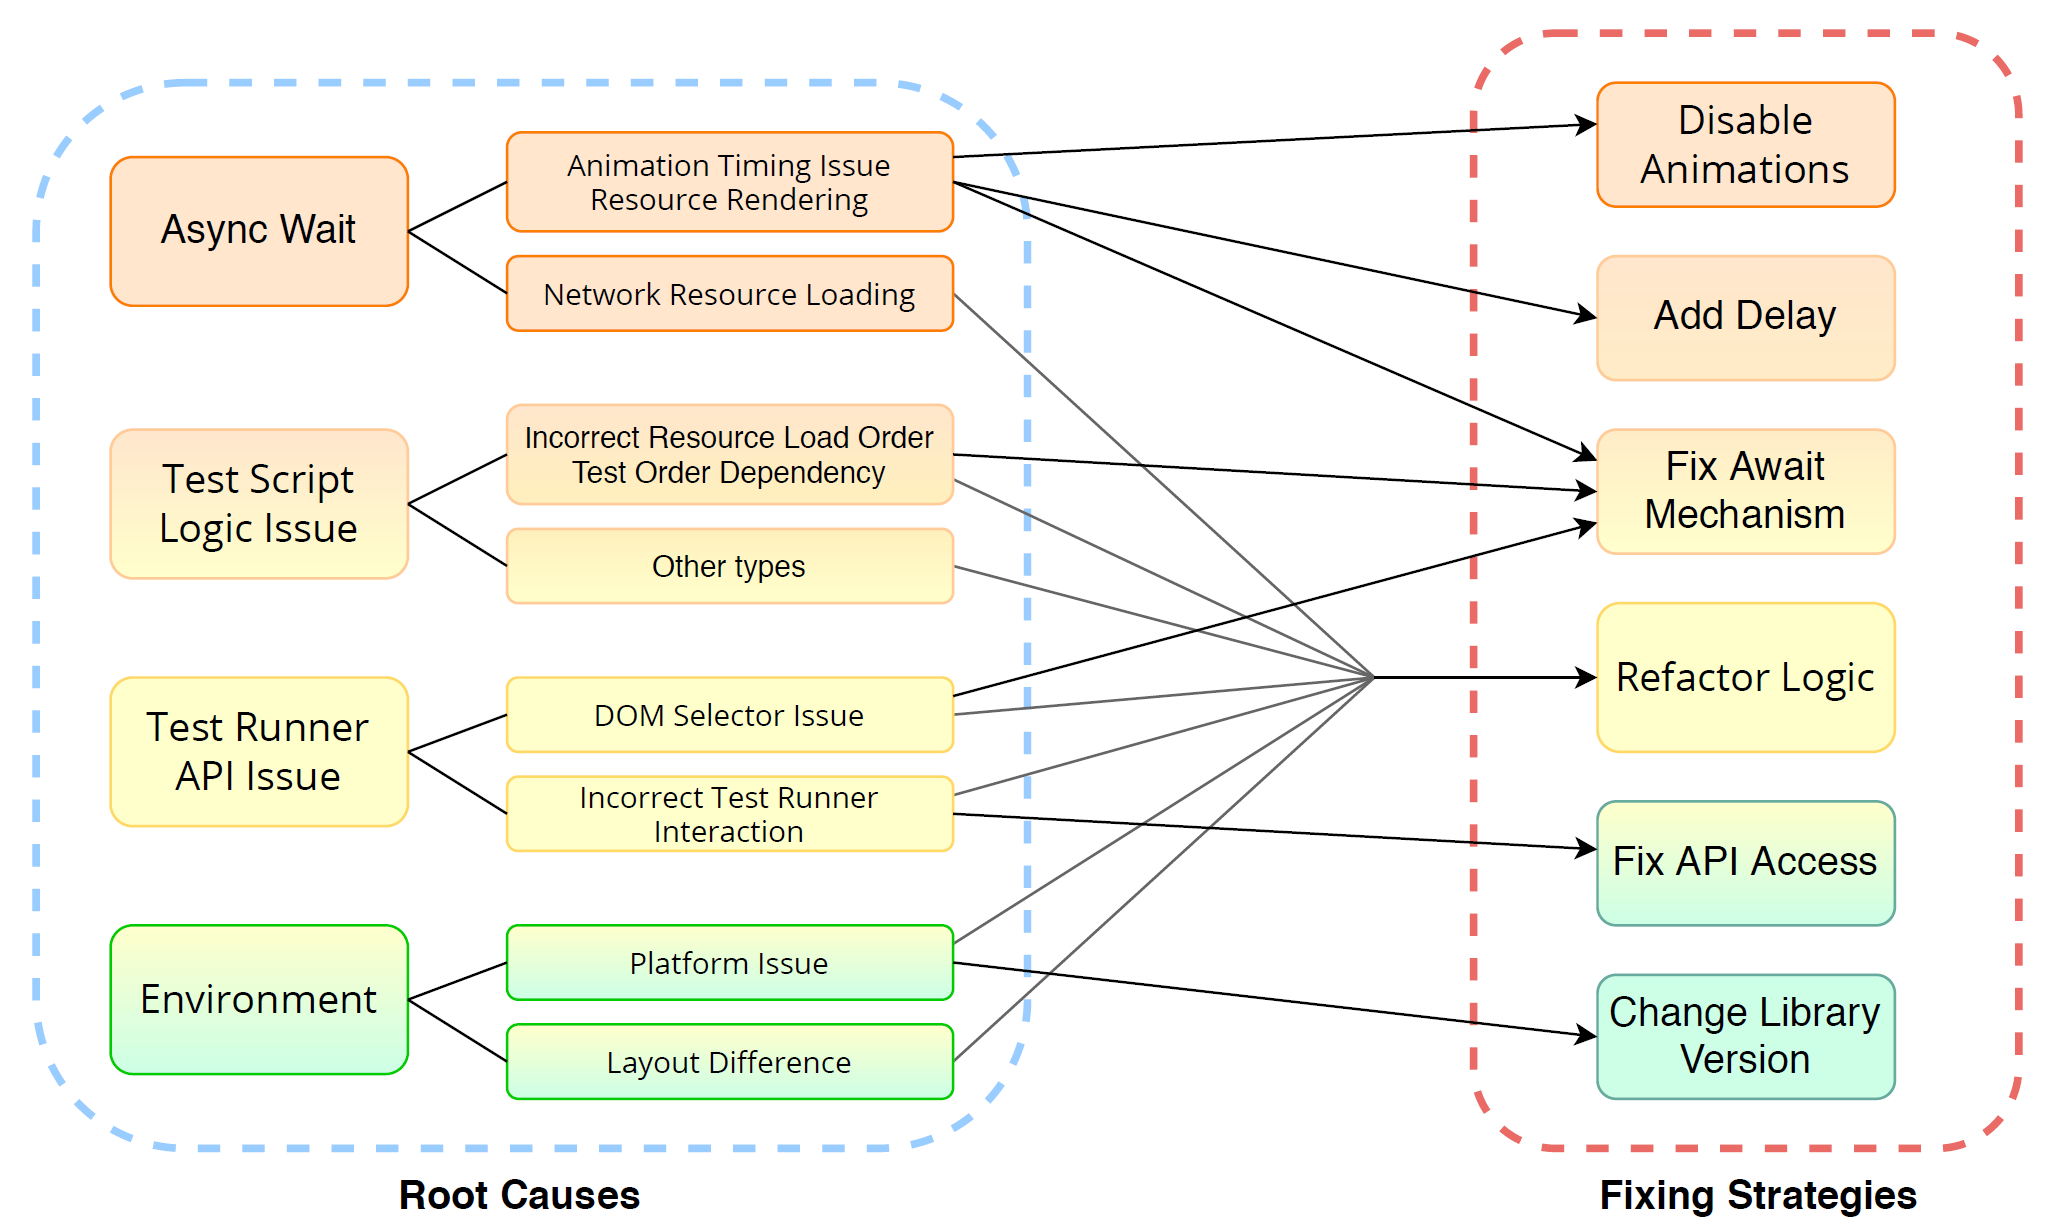
Figure 2 is an example of a Network Resource Loading issue found in the influxdb project. The test fails due to attempting to interact with an updated UI during an incomplete network response.
Figure 5 presents an Animation Timing issue within the plotly.js where the transition effect applied in a bar chart is behaving incorrectly.
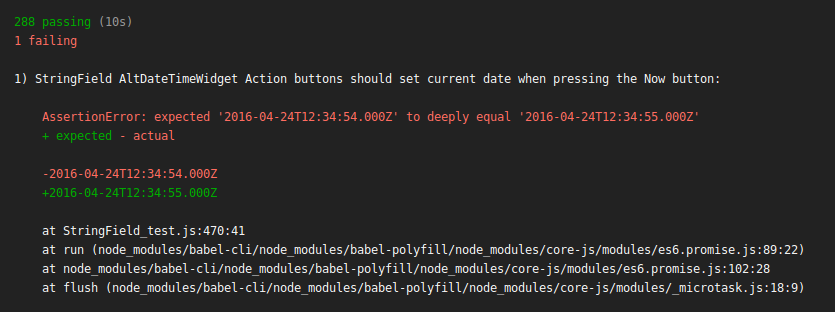
Figure 7 shows the log of a Continuous Integration system from within the react-jsonschema-form project. It shows a Time issue where the comparsion between two timestamps is too strict.